
Solar PV Spreadsheet
Here we investigate how to work out the economics of the returns you might get from a domestic solar photovoltaic installation.
Background
In Feb. 2010 when the UK govt. finally announced that it would implement Feed-In-Tariffs (FITs) for micro-energy generation, we wanted to figure out if it would make any economic sense to put a large array of solar photovoltaic panels on our SSE facing roof.
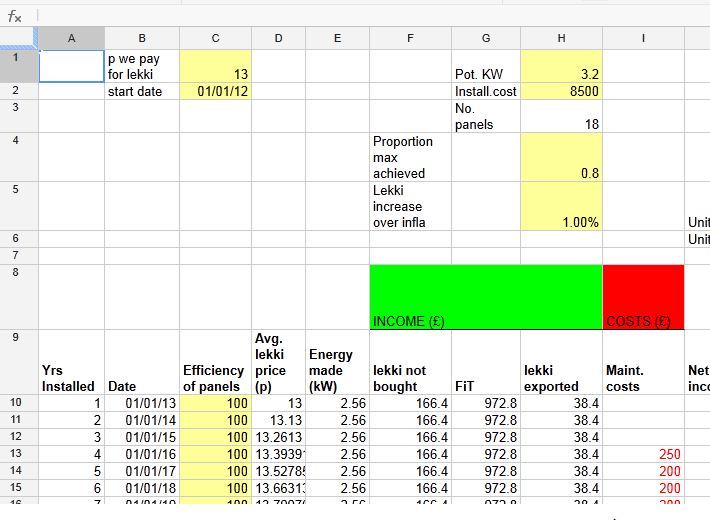
I worked up a spreadsheet (that I'm happy to share, see the end of this article) to help clarify the numbers. The way it works is that fields in yellow can be changed by users to try different assumptions -- because this is a guessing game about how the possible investment will perform. At the moment the spreadsheet has values in it that apply to our situation, but the idea is that anybody else can play with it to see how the numbers might work out for them.
The fields that you are meant to change
- C3: Current price paid (GBP) for each unit (kW) of electricity. We currently pay 13p/unit, 10p/unit is more typical
- C4:Start date (when installation completed)
- H3: Potential max. MW of system
- H4: Cost of system
- H5: Number of panels (assuming 180 watts each)
- H6: Proportion of potential energy actually yielded
- H8: Annual increase in electricity prices in excess of general inflation. Electricity prices are forecast to keep rising sharply
- L3: Feed In Tariff
- L4: Export Tariff (minimum would be 3p, but many providers pay much more)
- K7: %of units exported
- M6: Building Society account rate of interest, net of both general inflation rate and tax. 0.5% might be more realistic, 1.5% in boom times or higher if you're a non-tax payer.
What the Columns Mean
- A: Years after installation
- B: Date
- C: Efficiency of PV panels as proportion of manuf. spec (expected to decline over time, SolarFocus said 100% over first 10 years, 85% in years 11-20)
- D: Average Electricity price per annum
- E: Energy Made by the system (kW)
- F: Money saved off bill (not imported from grid)
- G: Feed-in-Tariff
- H: Payment for energy exported
- I: Maintenance costs
- J: Net income (F+G+H-I)
- K: Cumulative income (sum of J13:Jcurrent)
- M: Balance of investment; installation cost (G4) minus income received so far (J)
- N: How much we're ahead for going with Solar PV rather than cash in a Building Society (K-M)
Notes
H6 The installed system might be "3.2 kW" but you'll never get that, about 80% of the installed system's max would be typical (lots of studies I consulted). H6= % electricity generated compared to theoretical maximum -- figures between 78-100% I found in real life case studies.
How much electricity would be used by us and how much would be exported? We save the most money the more of it we use ourselves (because the rate paid for export is usually much less than the rate we pay to import.
Nobody -- not even the Energy Savings Trust -- seems to know what a true typical figure might be for the percentage of generated electricity exported by a domestic solar pv installation. I think exporting 0% is very unrealistic, though!
In the spreadsheet I note many example figures cited in case studies/quotes. I guess 50% is best guess possible.
Our conclusions
Play with the yellow fields and watch what happens in Column N; you want to see black numbers in there as early as possible.
If you don't mind the opportunity costs and paying a bit over the odds for electricity in order to reduce your C footprint, solar pv is a reasonable investment over a decades long time scale.
We could move long before we got our money back, but the information that our system is generating income > 1.2k/yr would undoubtedly inflate the sale price of our house, so might be no loss at all there.
Electricity prices have grown by at least 25% more than inflation in last 5 years or so. If that trend continues then solar pv as an investment today would pay for itself (with profits equal to what you'd get by just sticking the money in the bank) quite quickly.
Further Caveats / Warnings
Unfortunately there are a lot.
Spreadsheet ignores discount rate and opportunity costs; they basically refer to the idea that money in hand and accessible now is a lot more valuable and useful than income in the future, and income in the near future is preferable to income in the far future.
Nothing in here about planning permission costs, usually not required.
To qualify for FITs, the installation must be done by an MCS-certified installer (watch for this!!)
Read any installation quotes you get very carefully for the assumptions that would-be providers make in showing how much money you might get back. Some of the assumptions are quite unrealistic, you'll probably find!
The Spreadsheet
You can view the spreadsheet on Google Docs, and take a copy if you wish: Solar PV Return on Investment. Alternatively, you can browse the spreadsheet below: